Cumulative Moving Average

A cumulative moving average, computes the running averages of an ordered datum stream.

For example, an investor may want the average price of all of the stock transactions for a particular stock up until the current time. As each new transaction occurs, the average price at the time of the transaction can be calculated for all of the transactions up to that point using the cumulative average, typically an equally weighted average of the sequence of i values x1, …, xi up to the current time:

CA_i = {{x_1 + \cdots + x_i} \over i}\,.

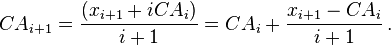
The new cumulative average when a new value xi+1 arrives can be calculated using the formula:

CA_{i+1} = {(x_{i+1} + iCA_i) \over {i+1}} = {CA_i} + {{x_{i+1} - CA_i} \over {i+1}}\,.

Following is an example of cumulative moving average of  Google prices.

CMA

Cumulative average in q

KDB provides a built in function avgs (running averages) to calculate the cumulative averages.

q)avgs 17 23 44 12 2 36 37 44 28 20
17 20 28 24 19.6 22.33333 24.42857 26.875 27 26.3

If you are Sachin Tendulkar fan then you would be interested to see how he managed to keep CMA of his ODI runs near to 40.
SachinODI_CMA

Simple Moving Average

In financial applications a simple moving average (SMA) is the unweighted (or equally weighted) mean of the previous n datum points.

An example of a simple equally weighted running mean for a n-day sample of closing price is the mean of the previous n days’ closing prices. If those prices are p_M, p_{M-1},\dots,p_{M-(n-1)} then the formula is

\textit{SMA} = { p_M + p_{M-1} + \cdots + p_{M-(n-1)} \over n }

When calculating successive values, a new value comes into the sum and an old value drops out, meaning a full summation each time is unnecessary for this simple case,

\textit{SMA}_\mathrm{today} = \textit{SMA}_\mathrm{yesterday} - {p_{M-n} \over n} + {p_{M} \over n}

Following graph depicts the Moving Average of Google Weekly closing price for 8 years for window size 10 & 25

SMA

Below is an another example of a 5-day moving average evolving over three days

Daily Closing Prices: 9,10,11,12,13,14,15
First day of 5-day SMA:  (9+10+11 + 12 + 13 ) / 5 = 11
Second day of 5-day SMA:  (10+11+12 + 13 + 14 ) / 5 = 12
Third day of 5-day SMA:  (11+12+13 + 14 + 15 ) / 5 = 13

Moving average in q

KDB have a built-in function mavg to find the simple moving average :

q)5 mavg 9 + til 7
9 9.5 10 10.5 11 12 13

Note in the above example the first 4 averages are the partial average as they use less than 5 terms to compute the average, so we will drop/cut the first 4 results.

In time series analysis, Moving Average at a particular data point is computed using previous N terms, so we can get the Moving average only after N data points.

q)4_5 mavg 9 + til 7
11 12 13f

Source: Wikipedia, StockCharts

Median Absolute Deviation

In statistics, the median absolute deviation (MAD) is a robust measure of the variability of a univariate sample of quantitative data. It can also refer to the population parameter that is estimated by the MAD calculated from a sample.

For a univariate data set X1X2, …, Xn, the MAD is defined as the median of the absolute deviations from the data’s median:

mad

that is, starting with the residuals (deviations) from the data’s median, the MAD is the median of their absolute values.

Source: Wikipedia

As described in my previous post  Standard Deviation, MAD is mostly used to overcome the outlier effect on sample population. It is a robust statistic, being more resilient to outliers in a data set than the standard deviation. In the standard deviation, the distances from the mean are squared, so large deviations are weighted more heavily, and thus outliers can heavily influence it. In the MAD, the deviations of a small number of outliers are irrelevant.

Example:

MAD

q Solution

q)d:3 5 5 6 6 6 8 90

q)mad:{med abs d-med[x] }

q)mad d
1f

q)stdevExcel:{c:count x; (dev x)*sqrt c%c-1 }

q)stdevExcel d
29.88281

q)dev d
27.95281

Absolute deviation

In statistics, the absolute deviation of an element of a data set is the absolute difference between that element and a given point. Typically the deviation is reckoned from the central value, being construed as some type of average, most often the median or sometimes the mean of the data set.

D_i = |x_i-m(X)|

where

Di is the absolute deviation,
xi is the data element
and m(X) is the chosen measure of central tendency of the data set—sometimes the mean (\overline{x}), but most often the median.

Source : Wikipedia

Average absolute deviation

The average absolute deviation of a data set is the average of the absolute deviations. Note here we are talking about averaging the absolute deviation calculated using the mean, median, mode, or some another measure of central tendency.

The average absolute deviation of a set {x1, x2, …, xn} is

\frac{1}{n}\sum_{i=1}^n |x_i-m(X)|.

The choice of measure of central tendency, m(X), has a marked effect on the value of the average deviation. For example, for the data set {2, 2, 3, 4, 14}:

Measure of central tendency m(X) Average absolute deviation Method
Mean = 5 \frac{|2 - 5| + |2 - 5| + |3 - 5| + |4 - 5| + |14 - 5|}{5} = 3.6 Mean Absolute Deviation using Mean
Median = 3 \frac{|2 - 3| + |2 - 3| + |3 - 3| + |4 - 3| + |14 - 3|}{5} = 2.8 Mean Absolute Deviation using Median
Mode = 2 \frac{|2 - 2| + |2 - 2| + |3 - 2| + |4 - 2| + |14 - 2|}{5} = 3.0 Mean Absolute Deviation using Mode

There are several other Absolute Deviation method exist like Median Absolute Deviation using Median, Maximum Absolute Deviation using Mean etc which are simply combination of various Central Tendencies and the aggregation of Absolute Deviation.

q functions

For calculating the aforementioned Central Tendencies , q already provides functions to calculate the median(med) and mean(avg). There is no function to calculate the mode, however implementation is pretty much straightforward. Checkout my another post Mode where i have already implemented mode in q.

q)med 2 2 3 4 14
3f

q)avg 2 2 3 4 14
5f

k)mode:{&:max[c]=c:#:'=:x}

q)mode 2 2 3 4 14
enlist 2
 

Mode

The mode is the value that appears most often in a set of data.

Like the statistical mean and median, the mode is a way of expressing, in a single number, important information about a random variable or a population.

The mode is not necessarily unique, since the same maximum frequency may be attained at different values.

Source: Wikipedia

The mode of a sample is the element that occurs most often in the collection.

For example: Mode of the sample {3, 7, 5, 13, 20, 23, 39, 23, 40, 23, 14, 12, 56, 23, 29} is 23.

It is not necessary that the mode for a given sample is always unique.  There could be multiple modes of the given dataset, if it have 2 modes then we call the dataset as bimodal and if it have more than 2 modes then we call the dataset as multimodal.

bimodal example : {1, 3, 3, 3, 4, 4, 6, 6, 6, 9}  have 2 modes 3 & 6.

There is currently no built in function in q for finding the mode. Lets try writing it, a simple function could be :

q)mode1:{key[d]where max[c]=c:count each value d:group x}
q)mode1  1 2 3 2 4 5 3 5 6 4 3 2
2 3

The above function is simple but we are not utilizing the features which comes automatically with the dictionary datatype in q.

Here is the new definition, which will return all the modes of the input sample:

q)mode:{where max[c]=c:count each d:group x}
q)mode  1 2 3 2 4 5 3 5 6 4 3 2
2 3

Note that the count, max and where works in a different way in case of dictionary. Here “count each” is actually counting the values corresponding to each key and returns a dictionary, max looks up the maximum value of dictionary range and where returns the key for true dictionary range.

The k equivalent of the above mode function is

k)mode:{&:max[c]=c:#:'=:x}

Triangular number

A triangular number or triangle number counts the objects that can form an equilateral triangle.

As it can be seen in the diagram, the nth triangle number is the number of dots composing a triangle with n dots on a side, and is equal to the sum of the n natural numbers from 1 to n.

Traingular Number

The nth term of the sequence of triangle numbers is given by, tn = ½n(n+1); so the first ten triangle numbers are:

1, 3, 6, 10, 15, 21, 28, 36, 45, 55, …

q code for generating the nthTriangular number :
triangleNo:{0.5*x*x+1}

To generate the first 10 traingular number:

triangleNo each 1 + til 10

Since q operators can also be applied to vectors, you can avoid use of each

triangleNo 1 + til 10

Champernowne’s constant

In mathematics, the Champernowne constant C10 , named after mathematician D. G. Champernowne, is a transcendental real constant whose decimal expansion has important properties

For base 10, the number is defined by concatenating representations of successive integers:

C10 = 0.12345678910111213141516… 

Champernowne constants can also be constructed in other bases, similarly, for example:

C2 = 0.11011100101110111… 
C3 = 0.12101112202122… 

Project Euler Problem 40

For the below Champernowne constant (C10) :

0.123456789101112131415161718192021…

It can be seen that the 12th digit of the fractional part is 1.

If dn represents the nth digit of the fractional part, find the value of the following expression.

d1 × d10 × d100 × d1000 × d10000 × d100000 × d1000000

q solution

a:raze string til 1000000
prd "I"$/:a `int$10 xexp til 7

Difference between standard deviation function of MS Excel and KDB

As per wikipedia “standard deviation (represented by the symbol sigma, σ) shows how much variation or dispesion exists from the average (mean, or expected value).”

Steps :

1. Consider a Population consisting of  n values , first find the mean (average)  m.
2. To calculate the Population Standard Deviation, compute the square of the difference of each data point and the mean.
3. compute the average and then take the square root.

Population Standard deviation

An estimator for σ sometimes used is the Population standard deviation, denoted by sN and defined as follows :

Sample standard deviation

The most commonly used estimator for σ is an adjusted version, the sample standard deviation, denoted by s and defined as follows :

Microsoft Excel and KDB both provides a function for calculating the Standard Deviation as stdev and dev respectively.

However Excel uses the sample Standard Deviation method while KDB uses the “sample Standard Deviation of the sample” method.

Following is the way to calculate the excel way of calculating the  standard deviation:

q)devExcel:{c:count x; (dev x)*sqrt c%c-1 }

q)devExcel[ 3 5 5 5 6 6 8 10]
2.13809

q)dev[ 3 5 5 5 6 6 8 10]
2f