In statistics and probability theory, standard deviation (represented by the symbol sigma, σ) shows how much variation or “dispersion” exists from the average (mean, or expected value). A low standard deviation indicates that the data points tend to be very close to the mean; high standard deviation indicates that the data points are spread out over a large range of values.
Source: Wikipedia
Steps to calculate the Standard Deviation:
- Find the mean of the sample population
- Compute the difference of each data points from mean and then square the difference.
- Compute the average of these values, and then take a square root.

Kdb provides dev function to calculate the standard deviation. However, it is a bit different from STDEV function of excel.
Check out my earlier post Difference between standard deviation function of MS Excel and KDB
Effect of outliers in Standard Deviation :
An outlier is a datum that is too large or too small in value as compared to the other data. Since mean is most affected by outliers, as same weight is given to all the data points, so is Standard Deviation.
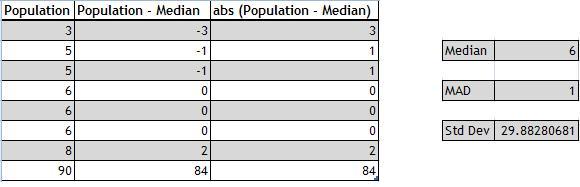
Let’s consider the same population which we have used in the above example to calculate Standard Deviation with an outlier (90). The impact of the outlier is drastic which can be seen in the following example.

Always remember that these points remain observations and you should not just throw them out. Instead, you should have good reasons to remove your outliers.
In data analysis, sometimes Median Absolute Deviation(MAD) is used instead of Standard Deviation.
Check out my another post on Median Absolute Deviation for more details and how to calculate it in KDB.


 ), but most often the median.
