A mathematical function of a single variable that remains constant within each of a series of adjacent intervals but changes in value from one interval to the next.
Examples :
- Mathematical functions like floor function, ceiling function, signum function
- A constant function is a trivial example of a step function e.g. y=1
- The rectangular function, the normalized boxcar function, is the next simplest step function, and is used to model a unit pulse.
Step function in KDB
Signum function
The function signum returns -1, 0 or 1 if the argument is negative, zero or positive respectively. It can be applied item-wise to lists, dictionaries and tables, and to all data types except symbol.
q)signum  -1 -3 9 0 2 -2 3
-1 -1 1 0 1 -1 1i
Floor function
The floor function maps a real number to the largest previous integer. More precisely, floor(x) =  is the largest integer not greater than x.
q)floor 8.4 6.3 9.3 5.4 3.8 9.7 8.8 5.8 6.8 4.5
8 6 9 5 3 9 8 5 6 4
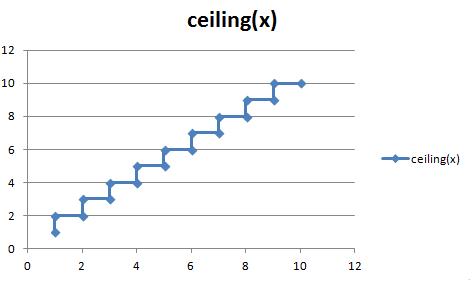
Ceiling function
The ceiling function map a real number to the smallest following integer. More precisely, ceiling(x) =  is the smallest integer not less than x.
q)ceiling 8.4 6.3 9.3 5.4 3.8 9.7 8.8 5.8 6.8 4.5
9 7 10 6 4 10 9 6 7 5
Sorted attribute (`s#)
The sorted attribute(`s#) when applied to a dictionary makes the dictionary into a step function.
q)sd:`s#1 3 5 7 9!1 3 25 49 81
q)d[6]
25
q)d[8]
49
Temporal Data
In traditional RDMSs, temporal changes in data are often represented by adding valid-time interval information to each relationship. This is usually achived by adding start and end columns to the relational tables.
Applying a sorted attribute(`s#) on a keyed table gives similar effect in KDB. check out more on Temporal data.
Parted attribute (`p#)
The parted attribute (`#p) indicates that the list represents a step function in which all occurrences of a particular output value are adjacent. The range is an int or temporal type that has an underlying int value, such as years, months, days, etc. You can also partition over a symbol provided it is enumerated.
q)`p#5 3 3 4 4 4 1 1 1 2
